See How It Works
Sketch the space, place sensors, and review overnight activity from anywhere — all through one dashboard.
Sketch the Space
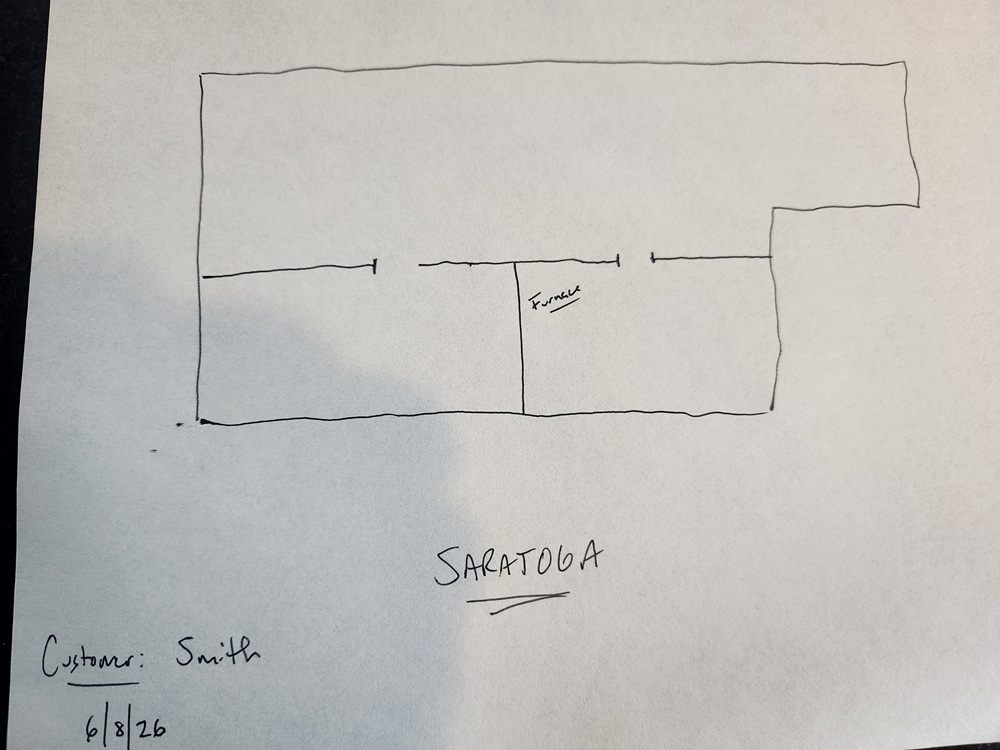
Start by sketching the floorplan — draw walls, label rooms, mark key spots like appliances or suspected entry points. Tap to place, drag to draw. It takes a few minutes on any browser.
Once the space is mapped, place sensors on the sketch. Drop one behind the fridge, another near a doorway or where you've heard activity — wherever makes sense to look first. The visual layout helps you think through coverage, and it's what turns the overnight activity into a heat map you can read at a glance.
Try the Sketch ToolPlace Sensors Anywhere
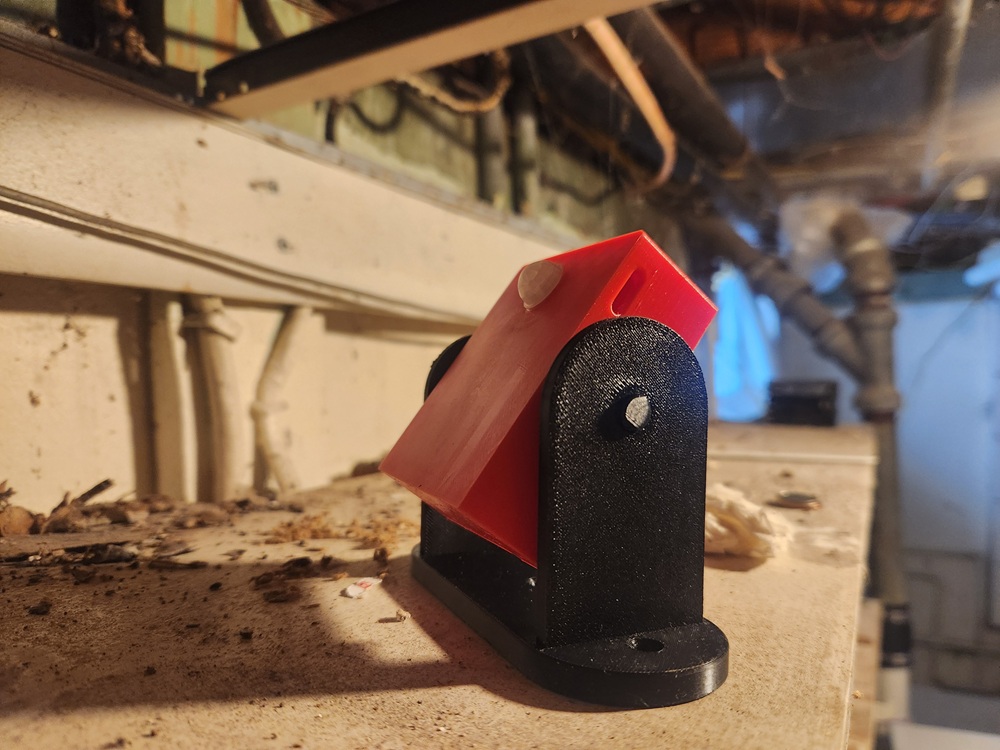
Flat floors are easy. But rodents travel along pipes, across joists, and through spots you can't just set a sensor on. That's why every kit includes GripMounts for wrapping around pipes and TiltMounts for angling up from the floor or hanging from a joist.
Wherever people and rodents share the same space, that's where the cones come in. A bare sensor under a sink or cabinet might trigger when someone walks past. Snap a cone on, and the detection area narrows — now it only sees motion between the sensor and the wall it's pointed at. Someone walking by won't set it off. A rodent running the baseboard will.
Mounts get the sensors where they need to be. Cones control what they see. Five minutes and a screwdriver — your sensor goes wherever the rodents go.
See the Placement GuideReview the Night From Anywhere
Open the dashboard from anywhere — your kitchen table, your phone, wherever you are. Playback compresses last night's activity into seconds. Growing circles show where sensors triggered — the bigger the circle, the more activity in that spot.
Control the speed. Pause on interesting moments. Compare nights to see whether activity is climbing or dropping as you act on it. Over a few days, patterns emerge — and you know exactly where to focus next.
See Playback in ActionThe Deployment Process
From install to actionable data in about a week
Set It Up
Plug in the base where you need it and connect to WiFi. Sensors are already paired — we do that before shipping — so they wake up and connect on their own.
Sketch & Place
Draw the space, place sensors in suspect areas. Mark positions on the sketch so you can read the activity as a heat map and know where everything is.
Review & Adjust
Check playback each morning. Move sensors toward the activity to close in on the path. Narrow it down over a few nights.
Act & Confirm
Entry point found. Seal it and treat the problem — then keep monitoring to confirm the activity actually drops.
What to Expect
A typical diagnostic deployment from install to results
Set up and place sensors
Connect the base to WiFi. Sketch the space. Place sensors in the areas you suspect — along walls, near water sources, behind equipment. Takes about 20 minutes.
Review the first night
Open the dashboard and check playback. Did any sensors trigger? Which ones? How often? You might see nothing — that's useful data too. Or you might see a pattern forming that tells you exactly where to focus.
Reposition sensors toward the action
Data shows heavy activity in one corner of the room? Move sensors in that direction. You're narrowing down the travel path and zeroing in on entry points — with data, not guesswork.
Act on it and confirm
Entry point identified. Travel routes mapped. Seal it up and treat the problem, then keep sensors running to confirm activity drops. The before-and-after data is the proof the problem is actually handled — not just hopefully handled.
Resources
Tools and documentation for getting the most out of every deployment
Setup Documentation
Step-by-step guides for installation, sensor placement, and using the dashboard
Try the Sketch Tool
Practice drawing a floorplan before your first deployment
Live Playback Demo
See real overnight activity data visualized on a floorplan
Common Questions
Ready to Find Out What's There?
See the pricing, or find the path that fits your situation.